London
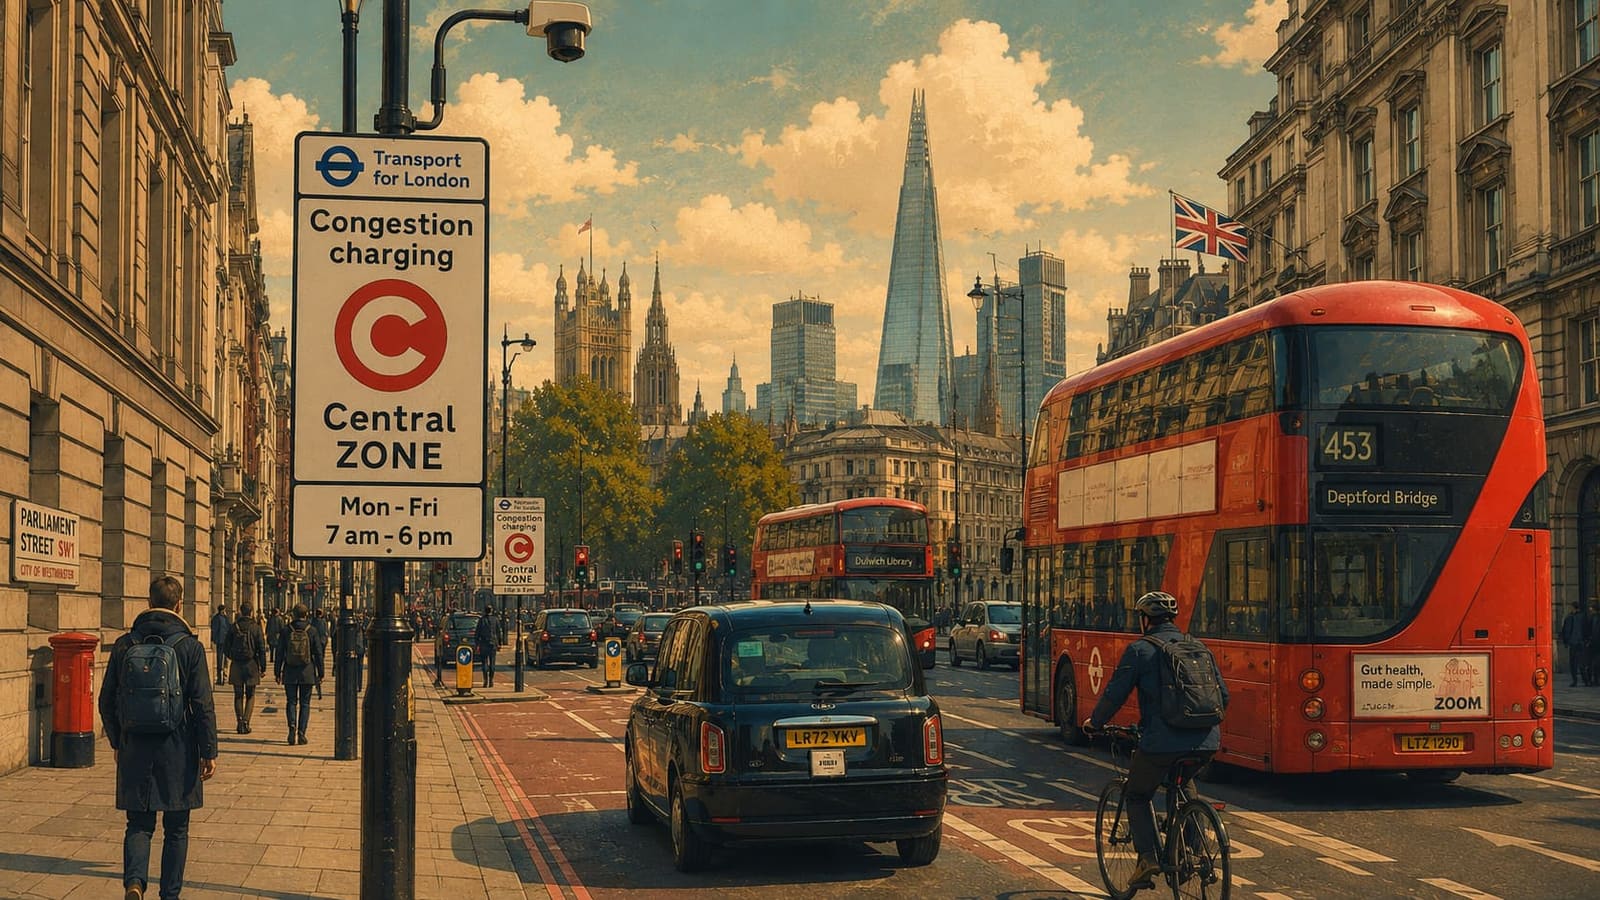
Illustration: 1001 Smart Cities
🇬🇧

London

Country
United Kingdom
Population
8.8M
Projects
16
First project
2003
Best evidence
Peer-reviewed
Last verified
27 August 2026
In the atlas since
15 July 2026

🤖 AI-generated city profile, summarising the source-checked entries below — how this works

London's thread is pricing the road. The 2003 congestion charge — camera-enforced and politically bold — cut zone traffic and became the model Stockholm and New York studied; the 2019 ULEZ reused the same camera rings to price pollution instead, cutting roadside NO2 across the city. Both carry the same lesson: the gains are real but erode, and pricing needs recalibrating to keep working.

The atlas documents 16 projects in London, the earliest dating to 2003: 6 with a documented success, 10 still running without a verdict. Every entry carries an evidence grade — the strongest here is peer-reviewed (2 entries) — and links its sources.

Start here

Three entries that show what London is actually doing.

The shape of London

Computed from the 16 entries below — a profile, not a score.

Outcome succeeded 6ongoing 10
Evidence peer-reviewed 2official 13media 1

How London got smart

London's smart-city story really begins in 2003 with two systems that both work by reading you as you move. The central London Congestion Charge used number-plate cameras to price entry into the centre — politically bold, quickly copied by Stockholm and studied by New York — while the Oyster card put a tap-in, tap-out smart ticket in every commuter's pocket, later opening up so an ordinary contactless bank card could pay the fare. One priced the road; the other turned every journey on the network into a data point, and together they set London's pattern: infrastructure that meters movement.

The next decade was about opening that data up. From 2010 the London Datastore published the city's statistics as a public default, and TfL's open data and unified API let anyone build on live transport feeds — the raw material behind Citymapper and hundreds of other apps. The same years added physical layers: the Santander Cycles hire scheme (2010) put a docked bike network on the streets, and the Lane Rental scheme (2012) began charging utilities a daily fee to dig up the busiest roads at peak times, ploughing the revenue into a roadworks-innovation fund. London's instinct was consistent — open the data, price the scarce thing.

From the mid-2010s London started instrumenting itself and building the governance to match. Sharing Cities in Greenwich (2016) trialled shared energy, EV and mobility tech at district scale; the Connected London full-fibre concession (2017) opened up TfL's ducts and building rooftops to close the city's connectivity gaps; and VivaCity's AI traffic sensors (2018) began counting pedestrians, cyclists and vehicles on-device without keeping identifiable footage. The coordination layer arrived in 2019, when 27 boroughs and the GLA founded the London Office of Technology & Innovation to buy and build shared tools rather than 33 separate ones — and, tellingly, London paired the instrumentation with a guardrail, publishing an Emerging Technology Charter and a public privacy register (2021) listing where sensors watch public space.

The most recent chapter is real-time optimisation — and its politics. The Ultra Low Emission Zone (2019) reused the congestion-charge camera rings to price pollution instead of congestion, cutting roadside NO2 but triggering fierce opposition as it expanded to the whole city; Low Traffic Neighbourhoods (from 2020) filtered through-traffic off residential streets with cameras and planters, cutting motor traffic inside by close to half in a peer-reviewed study yet seeing 27 of 113 schemes removed after protest or court challenge. Alongside the contested measures runs quieter machine work: adaptive traffic signals retiming thousands of junctions in real time, the Breathe London sensor network (2021) mapping air quality block by block, Thames Water's smart meters and AI leak-detection listening to the pipes across a leaky network, and TfL's BusSense (2026) mining the data from bus-mounted sensors to spot roadworks and disruption as they happen.

London
David Iliff, CC BY-SA 3.0, via Wikimedia Commons

All 16 projects in London

On a time axis, by the year each one started — 2003 to 2021. Pick a dot to read what it was.

  1. 2003: Central London Congestion Charging Scheme (Live)
  2. 2003: Oyster & Contactless Fare Payment (Live)
  3. 2010: TfL Open Data & Unified API (Live)
  4. 2010: London Datastore & Data for London Library (Live)
  5. 2010: Santander Cycles (Live)
  6. 2012: TfL Lane Rental Scheme (Live)
  7. 2016: Sharing Cities — Greenwich Smart District (Completed)
  8. 2017: Connected London Full-Fibre & 5G Programme (Live)
  9. 2018: Vivacity AI Traffic-Sensor Network (Live)
  10. 2019: Ultra Low Emission Zone (ULEZ) (Live)
  11. 2019: London Office of Technology & Innovation (LOTI) (Live)
  12. 2020: London Adaptive Traffic Signals (FUSION / Real Time Optimiser) (Live)
  13. 2020: Low Traffic Neighbourhoods (LTNs) (Live)
  14. 2021: Breathe London Air-Quality Sensor Network (Live)
  15. 2021: Emerging Technology Charter & London Privacy Register (Live)

No start date on record: Thames Water Smart Metering & AI Leak Detection

✔ Every published entry is checked against the public sources it cites before publication.

How the pieces connect

Editorial links between London's own entries — the city as a system, not a list.

Show 3 more connectionsShow fewer

What's next

Plans and announced trajectories — not yet documented results.

London's next moves are less about new gadgets than about consolidation and contest. The city is folding its data holdings into a single "Data for London" library so the Datastore era becomes shared infrastructure rather than scattered portals, and the full-fibre and small-cell rollout continues toward the mayor's target of closing the connectivity gap. The open question is political durability: ULEZ and LTNs show that camera-enforced schemes deliver measurable gains and provoke measurable backlash in equal measure, and both — like the congestion charge before them — will need recalibrating to keep working. London's real experiment now is whether a city can keep pricing and metering movement while carrying its residents' consent along with it.

Deeper reads

Where London appears in the atlas's own analysis.

Closest comparisons

Three cities the atlas reads next to London — the reason first, then the entries it rests on. Chosen by hand from the London threads below, not counted out of them.

  1. 🇪🇸 Barcelona

    The two European cities that have argued longest about who a street belongs to — London priced cars out of the centre, Barcelona designed them out of the block — and both have since had to give ground, in court or on the street.

  2. 🇩🇰 Copenhagen

    The cycling pair, and an honest one: London's docked bike-share is still running while Copenhagen's operator went bankrupt, and each reads its cyclists differently — London with cameras, Copenhagen by timing the lights to their speed.

  3. 🇹🇷 Istanbul

    The order is reversed on the two things that matter: Istanbul had a working fare card years before Oyster, London opened its transit and city data years before İBB — and each later arrived at the other's answer.

Show 45 further city threadsShow fewer

Every editorial link from London's entries into another city, strongest first. Each one is a statement about two projects, not about two cities — the three above are the ones the atlas is willing to make at city level.

Official strategy and sources

🏆 IMD Smart City Index 2025: #6
↗ Open data portalThe city's official open-data platform.
📎 Cite this city

1001 Smart Cities (2026). “Smart-city projects in London, United Kingdom.” The Smart City Atlas. https://1001smartcities.org/cities/london/ (last verified 2026-08-27). Data: CC BY 4.0.

The underlying data is free to reuse with attribution — see the open data page.