✍️ Reviewed & signed
Your Smart City Is Owned by Someone Else
28 July 2026 · updated 30 July 2026
Third-party ownership can buy a city speed, capital and expertise. It can also turn public policy into a dependency that outlives the people who signed the contract. Six rights, six systems from the atlas, and one test that matters more than the ownership label: contestability.
Read the insight →
✍️ Reviewed & signed
Fifty years of congestion pricing: from paper permits to satellite tolls
16 July 2026 · updated 24 July 2026
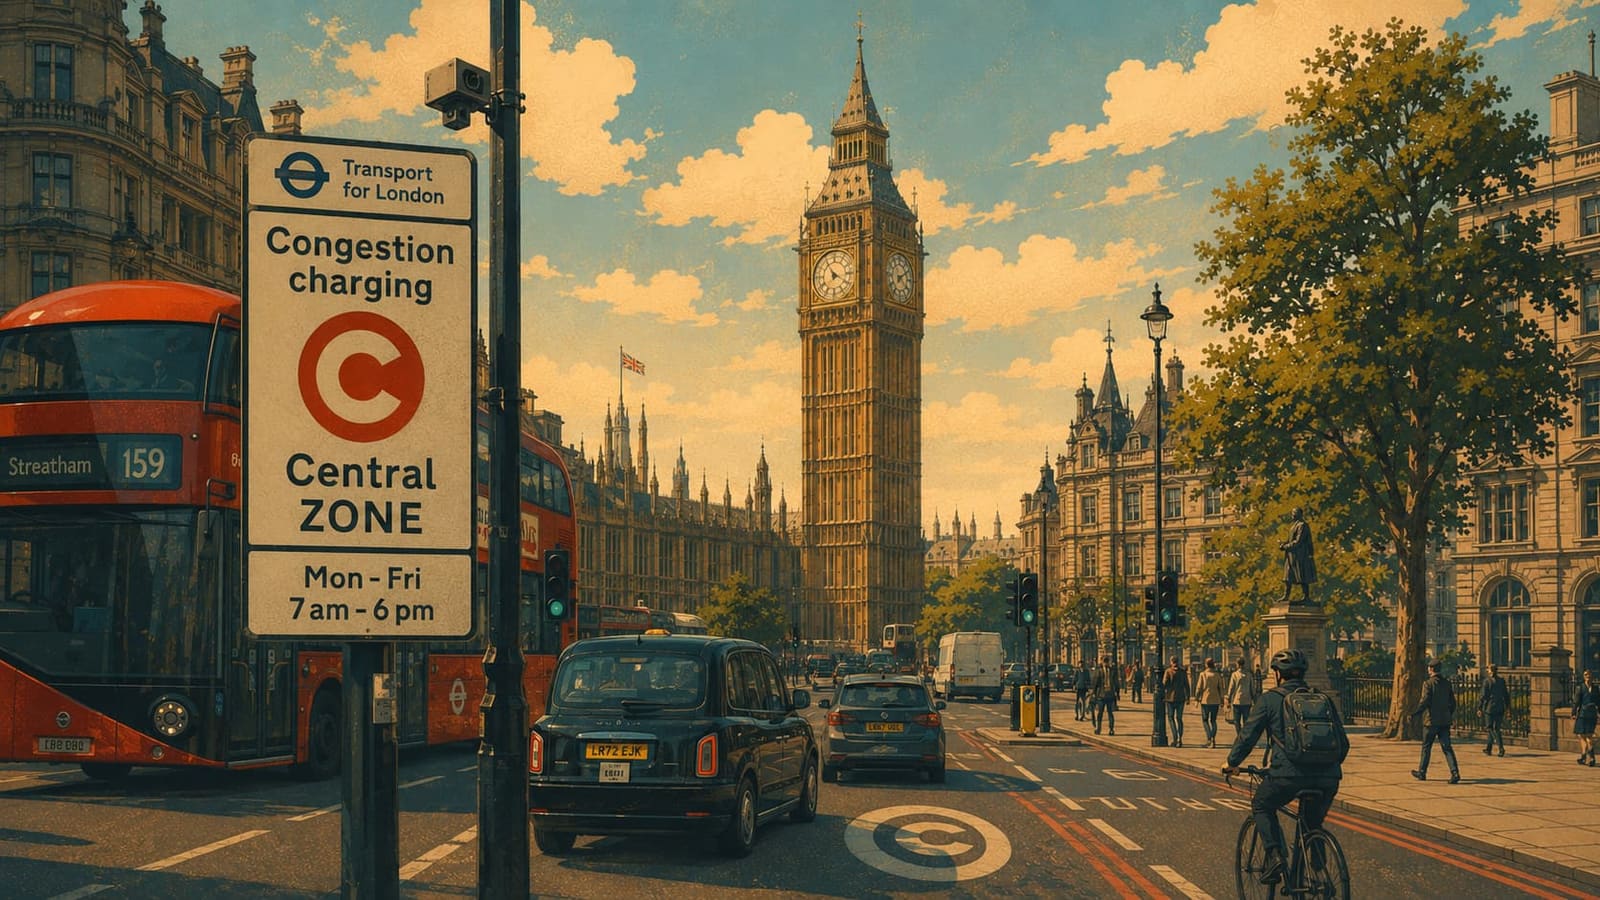
In 1975 Singapore charged drivers with paper licences checked by officers at 28 gantries. In 2025 New York became the first US city to price its core — and won in court. Half a century of one idea — congestion pricing, also called cordon pricing or road tolling: what worked, what voters killed, and what comes next.
Read the insight →
💸
The Price Nobody Publishes
14 August 2026 · updated 15 August 2026
Four out of five smart-city projects in this atlas never say what they cost. For the biggest, what exists is an approval or an estimate — never an account.
Read the insight →
🔍
Embarrassment Is a Public Good
8 August 2026
New York publishes numbers that make its electric buses look bad. Four other American cities bought the same buses and published nothing. Here is the uncomfortable result: the embarrassing number is the only one another city can learn from — and that pattern runs through every continent of this atlas.
Read the insight →
📟
A Reading Is Not a Decision
30 July 2026
Delhi's air index has legal force, Jakarta's triggers nothing, Osaka's tide gates close themselves. Six rungs between a measurement and an act.
Read the insight →
🌍
Hardware Stops, Data Doesn't
30 July 2026 · updated 14 October 2026
Cairo's bike share collapsed twice; Nairobi's grant-funded transit feed still runs. Across 41 donor-funded projects, what the money bought decided what lasted.
Read the insight →
🗺️
Your City's Problem Map Is Really a Map of Who Complains
27 July 2026 · updated 30 July 2026
Every 311 app, FixMyStreet report and Strava trace records two things at once: a problem, and someone's ability and willingness to report it. Cities that read the resulting map as a map of need end up serving the residents already best equipped to ask.
Read the insight →
🏙️
Urban digital twins compared: Singapore, Tokyo, Seoul and Rotterdam
22 July 2026 · updated 11 August 2026
Four cities, four things sold under one name. Singapore built — and quietly concluded — a national simulation environment, Tokyo opened its 3D data, Seoul made a municipal laboratory, and Rotterdam connected planning above and below ground. Which of them is actually a digital twin, and what can another city copy?
Read the insight →
Pipes or pennies
19 July 2026 · updated 28 July 2026
Bergen buried steel pipes under its old town so rubbish never touches a truck. Seoul just put a scale under the bin and a chip on your key ring. One cost over a billion kroner and still can't say what it saved; the other cost the price of a kitchen scale and cut food waste by a quarter on its first try.
Read the insight →
Asphalt or algorithms
17 July 2026 · updated 21 July 2026
Give a mid-sized city a million dollars against congestion and the best answer is probably not concrete. Adaptive traffic signals have four decades of field results behind them: impressive, messy, and increasingly fed by an unexpected sensor network, the city's own vehicle fleet.
Read the insight →
🏅
How countries rank their smart cities
16 July 2026 · updated 7 August 2026
Germany scores its cities yearly by fixed rules, the world's best-known index asks residents how it feels, and the EU doesn't rank at all — it selects. What the scoreboards reward, and where they disagree with reality.
Read the insight →
🚦
Showcase or use case — what does a smart city actually need?
16 July 2026 · updated 27 July 2026
Self-driving buses win headlines; digitising a permit process wins Tuesdays. Helsinki's world-famous mobility app is gone; the boring interface behind its journey planner now runs in three countries. The evidence says both matter, but for very different reasons.
Read the insight →
🪦
Why smart cities fail
16 July 2026 · updated 28 July 2026
Google's city of the future died citing a pandemic — after two years of privacy revolt. The best-documented smart-city failures follow six distinct patterns, and almost none of them are about technology.
Read the insight →
📖 Smart City Glossary
64 terms explained, each linked to real projects in the atlas — and growing.